
Every cap in here came from a measurement.
infographic builds a full-scale, text-dense information graphic from your data or a document, routing between an HTML render path and an image path, then checking the result with five scripts that print numbers instead of adjectives. The routing rule is the part that changed. I measured the assumption this whole category rests on, and it turned out to be defending the wrong failure.
For anyone shipping client-grade graphics who would rather be told “this one is missing a fact you gave me” than be handed something that merely looks finished.
opvs-skills install @di-atomic/infographicThen say: “build an infographic from this data” or “turn this report into a one-page graphic”.
The eight renders that moved the line
| Labels asked for | Spelling errors | What went wrong with the set |
|---|---|---|
| 4 | 0 | nothing, clean |
| 6 | 0 | nothing, clean |
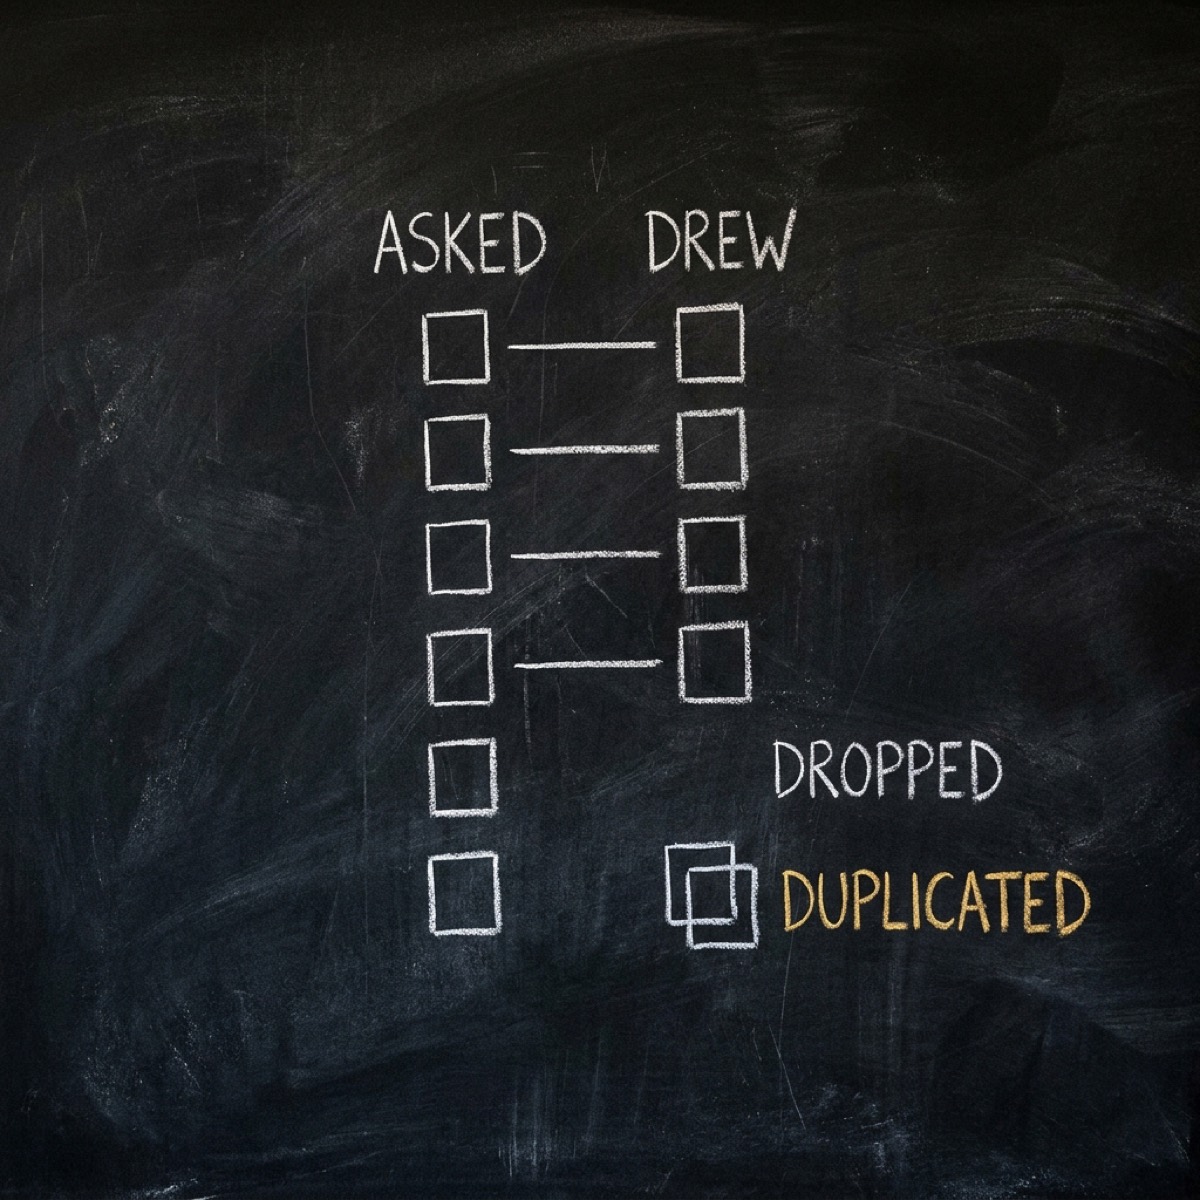
| 8 | 0 | drew 9 · WATER dropped · LEAF and FLOWER duplicated · STEM on the wrong icon |
| 8 (repeat) | 0 | drew 7 · SPROUT dropped · 2 icons with no label at all |
| 12 | 0 | 3 labels drawn off the bottom edge of the canvas |
| 16 | 0 | WASH dropped · HULL duplicated |
| 20 | 0 | COOL dropped · bottom row of 4 cropped away |
| 24 | 2 | LÉAF and GROST misspelt · 4 dropped · order scrambled · 4 cropped |
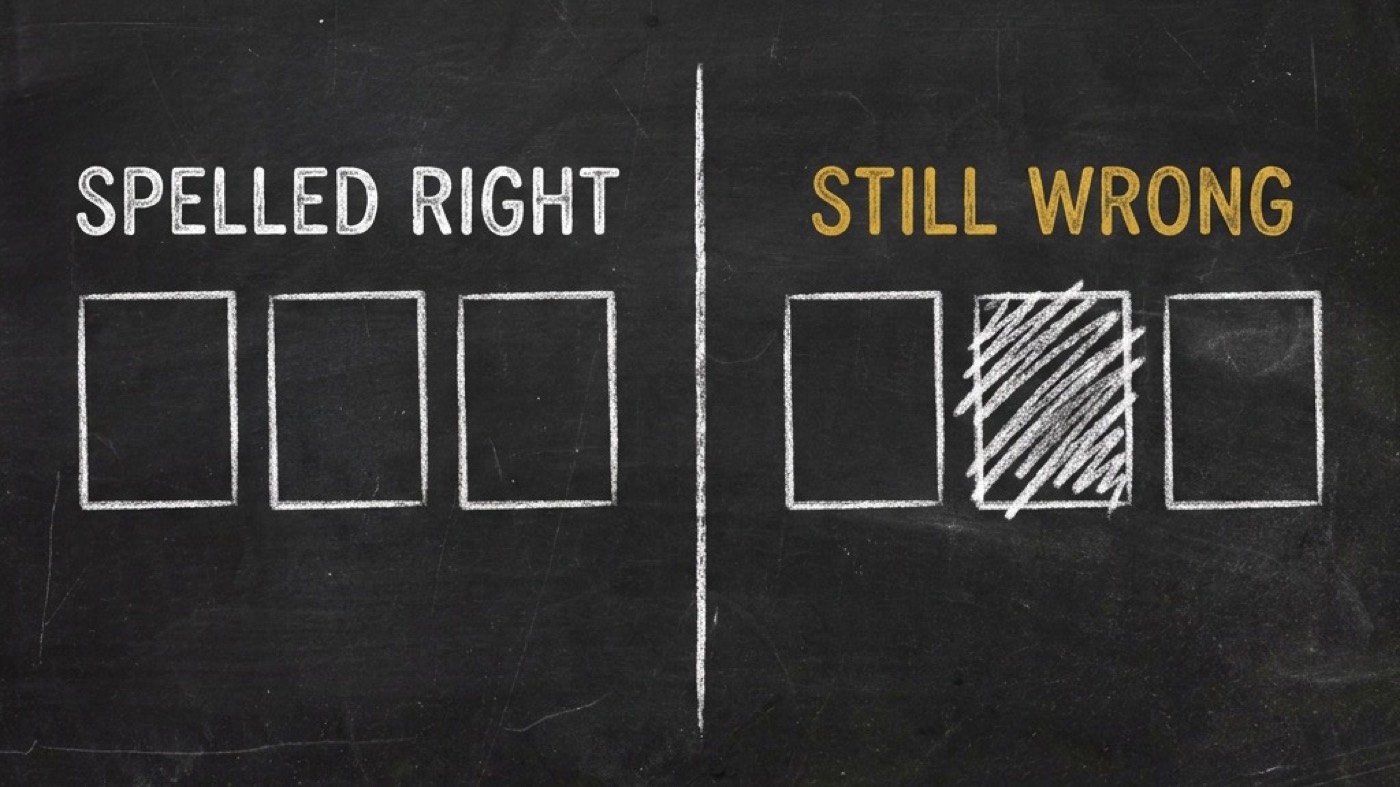
One variable, everything else held constant, every rendered string transcribed by hand. Spelling was perfect through twenty labels. What broke at eight was which labels appeared at all.
Why a graphic passes review and is still wrong
is every word readable?  yes
is the typography clean? yes
does it look finished?   yes

→ ship it

(one of your facts is not in the picture,
 one label is attached to the wrong icon,
 and nothing in the pipeline says so)
Every failure measured at eight labels and above survives this check untouched, because none of them are spelling failures.
requested set .. compared to the rendered set
dropped ....... named, one by one
duplicated .... named
mis-bound ..... named, with the wrong icon
bare icon ..... named
cropped ....... named
copy density .. read off the active canvas
unsourced ..... listed first, with the
                nearest match in your source

(all five scripts exit 0. you decide)
A report you can act on without trusting the writer, because it compares against the artifact rather than against the prompt.
A spellcheck passes the graphic that is quietly missing one of your facts.
Three bands on the image path
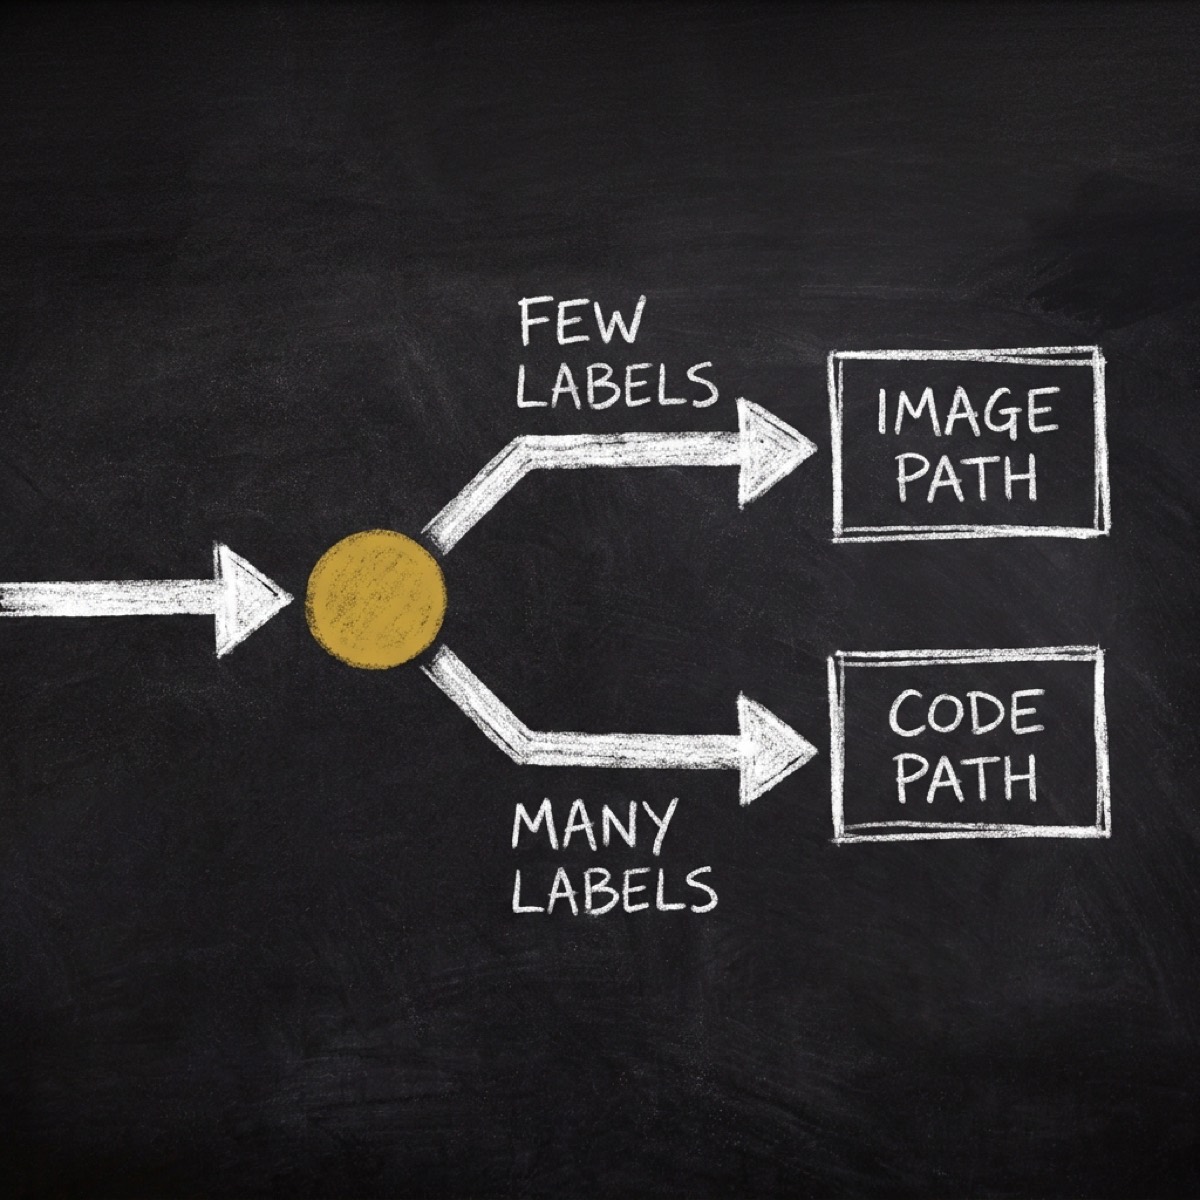
up to 6 labelsRouted. This is where both clean renders landed, and the set comparison still runs on the result rather than being skipped.7 to 16 labelsWarned. Labels may be dropped, duplicated or mis-bound, and the HTML path is offered instead. Both samples at eight failed, differently.above 16 labelsRefused, with the reason. Sixteen is a hard ceiling: asking for twenty-four returns sixteen labels and silently discards eight of your facts.Six labels can sit inside the ceiling and still come back with a broken set. The cap alone does not protect your facts. The comparison does.
What the sketch look does now
style/hand-drawn-markerRaster path, hard capped at six labels, because six is where the eight renders stayed clean. Unchanged in v0.2.0, and it now names its counterpart so the pair is findable.style/hand-drawn-htmlHTML path, token based, no label ceiling. The same register on a graphic carrying forty facts. Marker display face, handwriting body, drawn box edges, grained off-white paper.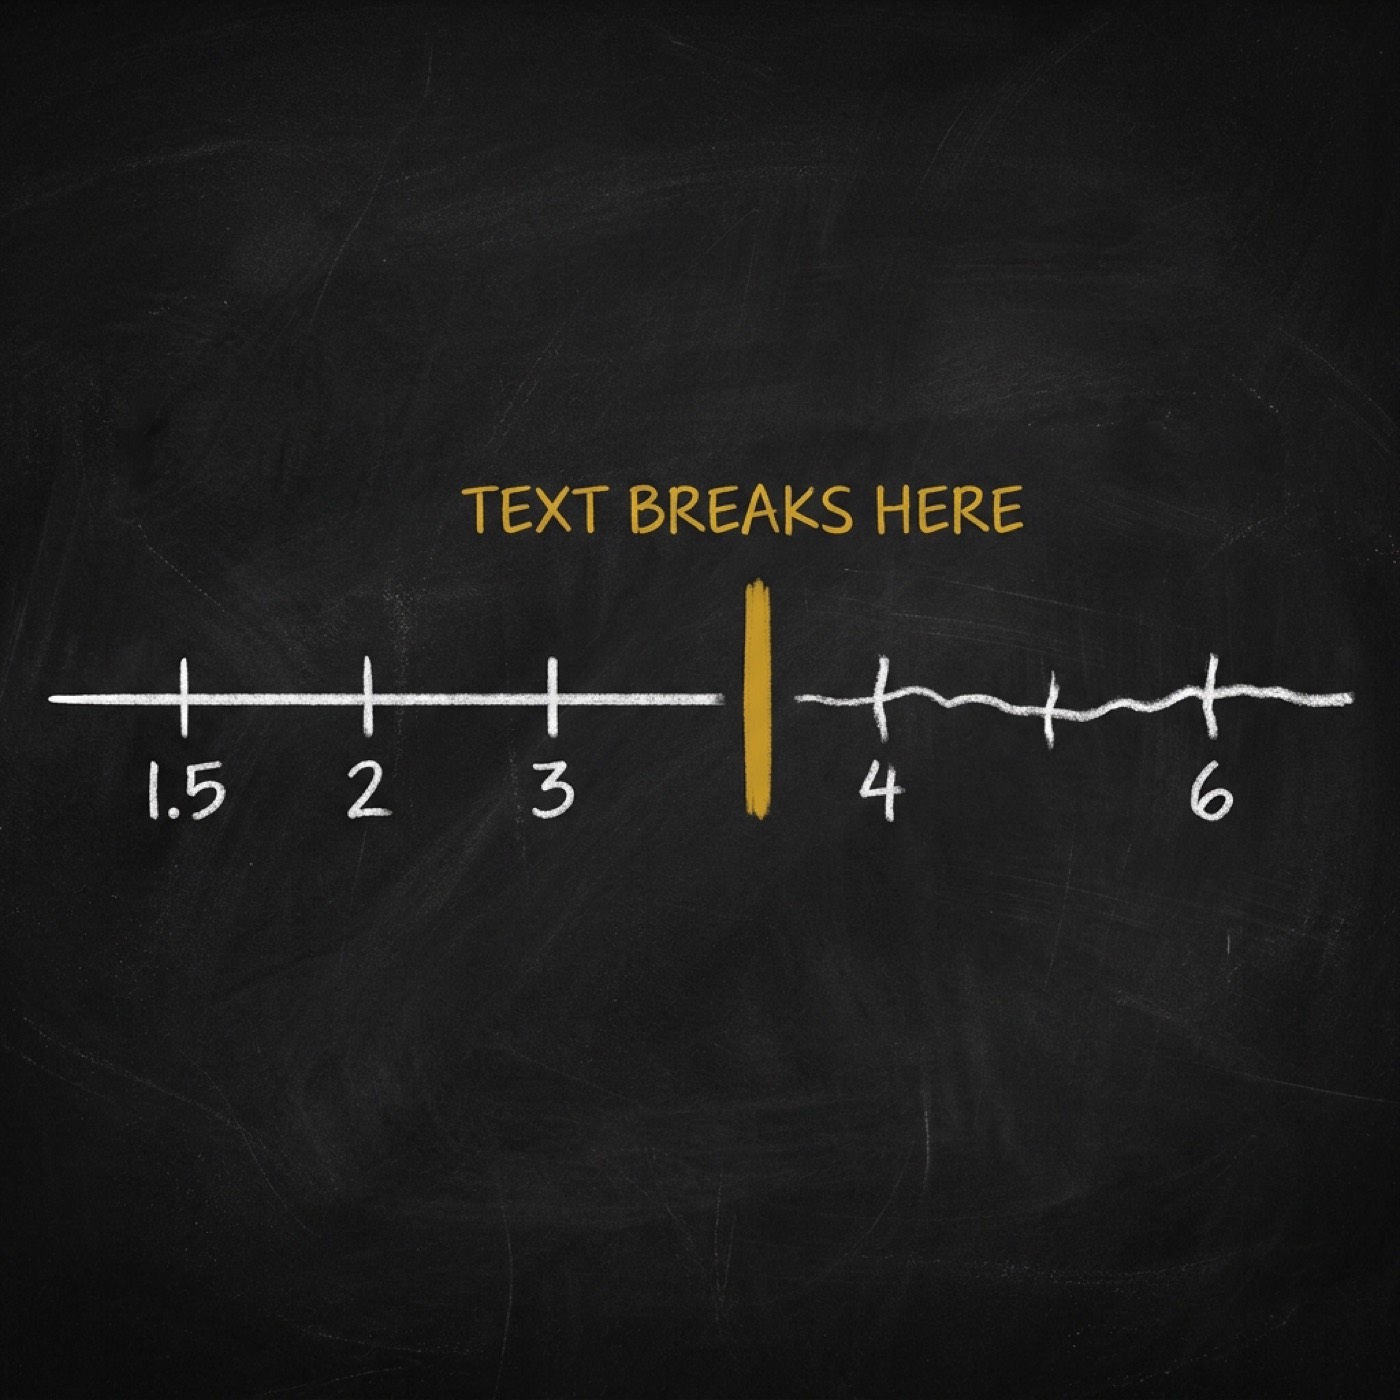
Two entries, two render paths, one look. Picking the style on the wrong path now fails the density check instead of passing it unmeasured.
What you actually get
Copy limits follow the canvas you chose
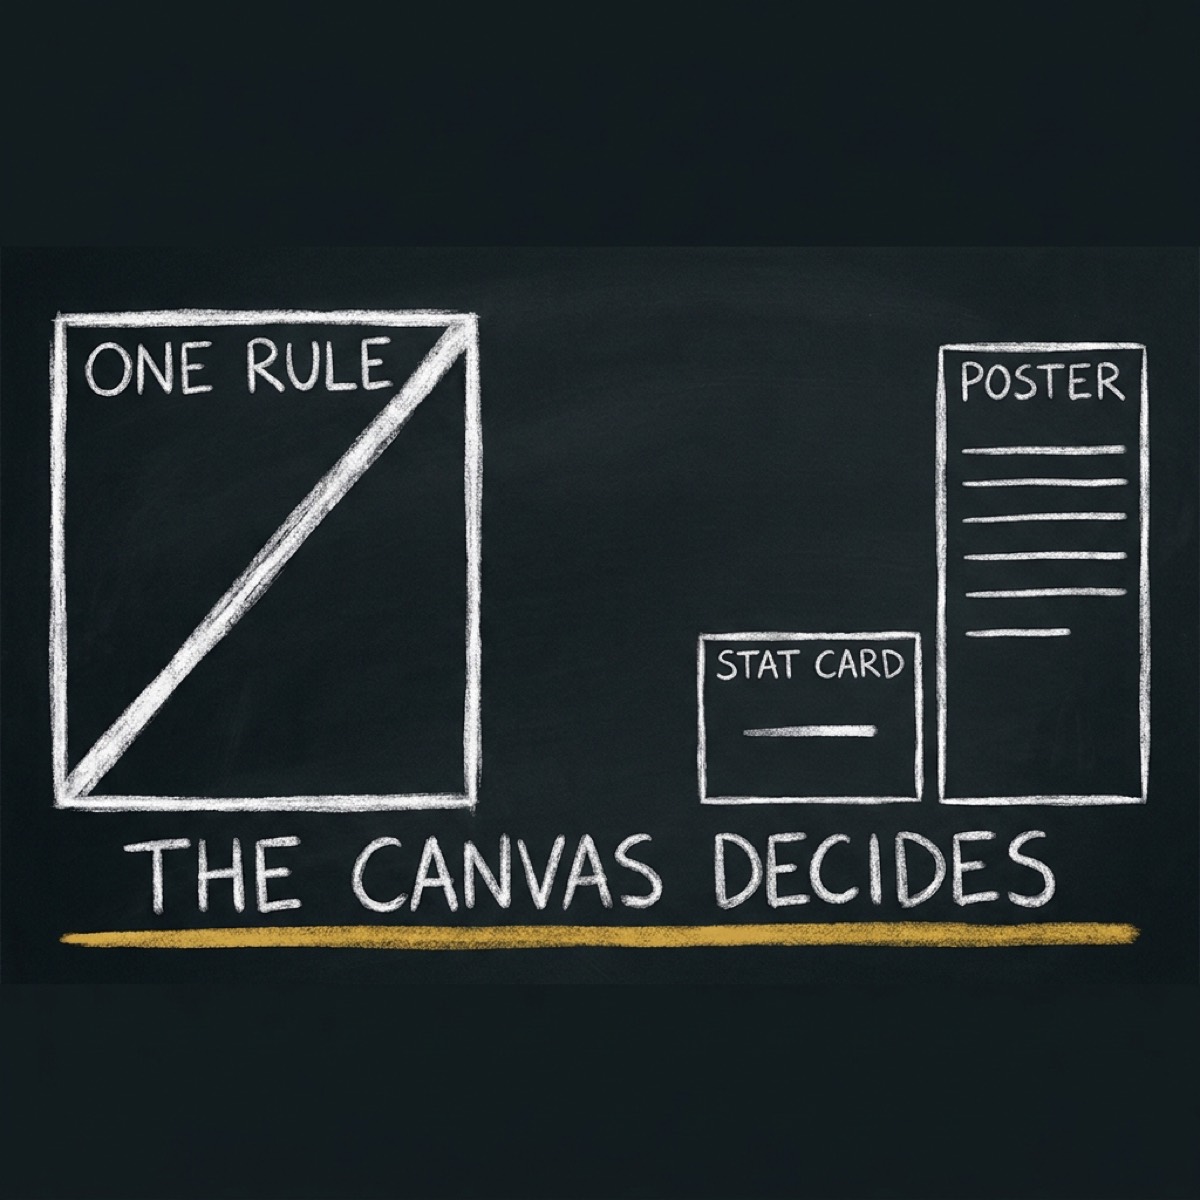
Fourteen words on a stat card, forty-five in a reference poster. verify-copy-density holds no cap table at all: it reads the limits off the active canvas, and when it cannot resolve one it reports NOT VERIFIED rather than substituting a default.
Invented claims are surfaced first, one by one
Each unsourced node is listed with its nearest match in your source and the edit distance to it, then stated in words. You can still ship it. You cannot ship it unknowingly.
Sixty pieces, each carrying its evidence
Canvases, sections, styles and elements derived from twenty-five measured published graphics. Every cap is tagged measured, cited, derived or thin, so you can see which numbers to trust and which are thin.
One graphic, start to finish
> "turn this quarterly report into a one-page graphic"

  content ........ 11 facts, 3 comparisons, 1 trend
  canvas ......... canvas/bento
  route .......... HTML path
                   11 labels is above the image
                   ceiling of 6, and the content
                   is tabular rather than
                   illustrative

  verify-copy-density ............. 9 atoms
                   1 WRONG CANVAS: body_paragraph
                   45w has no cap on canvas/bento
                   (it has one on canvas/poster)
  verify-density-caps ............. 11 cells
                   inside the observed max of 12
  verify-source-fidelity .......... 11 nodes
                   9 VERBATIM, 1 DERIVED-OK,
                   1 UNSOURCED: "$83 billion"
                   nearest source match:
                   "valued at around 83 billion"
                   the currency is not in there
  verify-render ................... 0 console
                   errors, 0 overflow, export
                   1800x1869, ink 0.0293
  grade-design .................... 78/100
                   concept 4/5, no veto

  all five exited 0.

  → "This graphic contains 1 claim not
     present in your source. Here it is.
     Ship, fix, or override with a reason."
Nothing here blocks you. The report is the product, not the exit code, and the report is shown before anything is delivered.
Two things it refuses to get wrong
What it will tell you it cannot do
- The label threshold is one model on one day. One image model, English only, short uppercase words, no digits, one aspect ratio, one sample per point and two at the failure point. Treat six as a floor that is per-backend and re-measurable, not as a universal curve.
- Numerals were deliberately excluded. Digits are the known-worst case for rendered text and were left out to isolate the set-integrity effect, so real labels containing figures are strictly harder than anything measured here.
- Multilingual is the thinnest area. Two of twenty-five corpus artifacts are non-English and zero render tests were run outside English. Unspaced scripts are flagged rather than silently counted, but there are no per-script caps, because the evidence for them does not exist.
- Commercial marketing infographics are under-sampled. Four of twenty-five, and three of those are business diagrams. That class is copyrighted and behind bot protection, so the gap is declared rather than padded.
- Brand tokens come from you. The skill takes the palette and type scale as user-supplied input and remembers them per brand. It does not read them off your website.
- The new HTML sketch style is evidence n=1. It was harvested from one rendered, gate-verified build rather than from the twenty-five-artifact corpus behind the rest of the registry, and the item says so on its face. Its contrast figures were recomputed here, not inherited.
- The scripts report, they do not gate. All five exit 0 by design. If you want a hard stop in CI, you are wiring that yourself on top of the numbers they print.
I inherited a rule from four skills, then measured it.
infographic is one skill in the system behind Di-Atomic, the marketing and compliance agency that runs cognitoAI, SpiderIQ and OPVS. If you want client-grade graphics produced in any of our seven languages, including regulated categories where the claim vocabulary is not optional, that is the day job.
Book a 30-min call with Di-AtomicJust want the skill? Get @di-atomic/infographic free.