- Name
-
@di-atomic/infographic
- Tagline
-
An infographic builder whose every cap came from a measurement
- Hero subhead
-
Builds a full-scale, text-dense information graphic from your data or a document, routes between an HTML render path and an image path on a measured condition, and checks the result with five scripts that print numbers instead of adjectives.
- Who it's for
-
Anyone shipping client-grade graphics who would rather be told this one is missing a fact you gave me than be handed something that merely looks finished.
- Version
-
0.2.0
- Tier
-
beta
- Path type
-
guidance-only
- Hero image
-

- Diagram image
-
- Install command
-
opvs-skills install @di-atomic/infographic
- Trigger phrase
-
build an infographic from this data
- Marketplace URL
-
https://market.opvs.ai/v/di-atomic/infographic
- Blog URL
-
https://di-atomic.com/blog/shipping-di-atomic-infographic
- Stat 1 value
-
20 vs 8
- Stat 1 label
-
labels where spelling still held, against where the label set broke
- Stat 2 value
-
25
- Stat 2 label
-
published information graphics measured to set the caps
- Stat 3 value
-
60
- Stat 3 label
-
composable pieces, each carrying the evidence tag that earned it
- Stat 4 value
-
5
- Stat 4 label
-
scripts that print observed against cap and leave the call to you
- What headline
-
What you actually get
- Cap 1 icon
-
📐
- Cap 1 title
-
Copy limits follow the canvas you chose
- Cap 1 desc
-
Fourteen words on a stat card, forty-five in a reference poster. verify-copy-density holds no cap table at all: it reads the limits off the active canvas, and when it cannot resolve one it reports NOT VERIFIED rather than substituting a default.
- Cap 2 icon
-
🧾
- Cap 2 title
-
Invented claims are surfaced first, one by one
- Cap 2 desc
-
Each unsourced node is listed with its nearest match in your source and the edit distance to it, then stated in words. You can still ship it. You cannot ship it unknowingly.
- Cap 3 icon
-
🧱
- Cap 3 title
-
Sixty pieces, each carrying its evidence
- Cap 3 desc
-
Canvases, sections, styles and elements derived from twenty-five measured published graphics. Every cap is tagged measured, cited, derived or thin. v0.2.0 adds style/hand-drawn-html, the sketch register on the HTML path with no label ceiling, paired with the raster style/hand-drawn-marker that is capped at six.
- Showcase headline
-
Two things it refuses to get wrong
- Showcase before caption
-
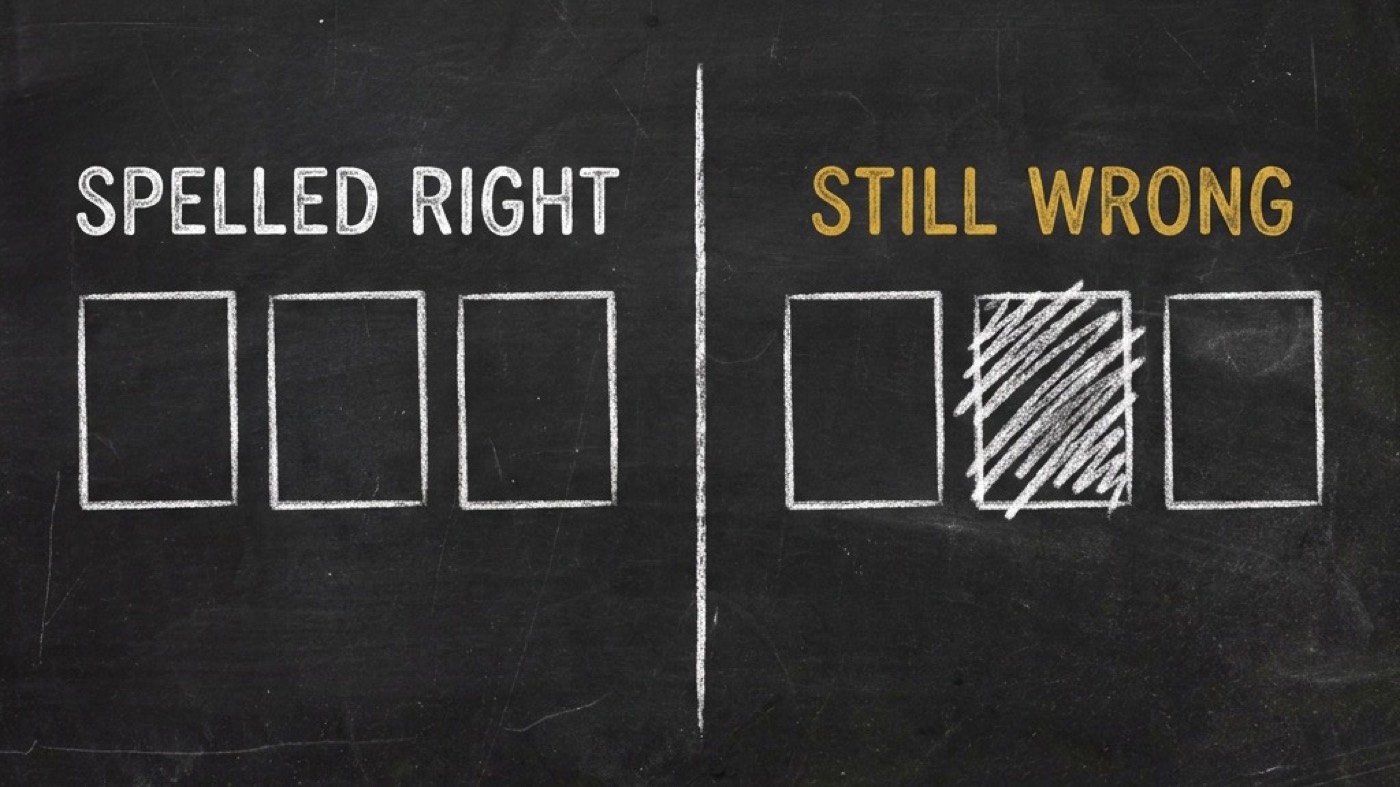
The check is a set comparison, not a judgement. Requested set in, rendered set out, and every difference named separately.
- Showcase after caption
-
A global word cap rejects real work. The best institutional graphic in the corpus runs bullets of twenty-five to forty-five words across three levels of nesting.
- Diagram caption
-
The router is the product. No prior art routes between the two paths at all; each picks one and defends it. This one splits on a condition I measured.
- Worked title
-
The eight renders that moved the line
- Worked example
-
One variable, everything else held constant. Spelling was perfect at 4, 6, 8, 12, 16 and 20 labels; the first misspelling appeared at 24. What broke at 8 was the label SET: WATER dropped, LEAF and FLOWER duplicated, STEM bound to the wrong icon. A repeat run at the same count failed differently: SPROUT gone, two icons with no label at all. From 12 labels up, labels were drawn off the canvas entirely. At 16, 20 and 24 the model rendered exactly 16 labels regardless of what was asked for.
- Worked framing
-
A checker that looks for unreadable text passes every one of those failures. So the image path caps at 6, warns from 7 to 16, refuses above 16, and the check on that path is an exact set comparison against the rendered artifact.
- Rel 1 icon
-
🎨
- Rel 1 name
-
@di-atomic/media-generator
- Rel 1 desc
-
Renders the image path through SpiderGate. This decides whether that path should be taken at all.
- Rel 1 url
-
https://market.opvs.ai/v/di-atomic/media-generator
- Rel 2 icon
-
📜
- Rel 2 name
-
@di-atomic/explainer-illustrations
- Rel 2 desc
-
Plans a set of small panels that explain an article. This builds one full-scale graphic that carries the data itself.
- Rel 2 url
-
https://market.opvs.ai/v/di-atomic/explainer-illustrations
- Rel 3 icon
-
📐
- Rel 3 name
-
@di-atomic/section-designer
- Rel 3 desc
-
Composes a page section in one of 150 design languages. This composes the graphic that sits inside it.
- Rel 3 url
-
https://market.opvs.ai/v/di-atomic/section-designer
- CTA headline
-
I inherited a rule from four skills, then measured it.
- CTA description
-
infographic is one skill in the system behind Di-Atomic, the marketing and compliance agency that runs cognitoAI, SpiderIQ and OPVS. If you want client-grade graphics produced in any of our seven languages, including regulated categories, that is the day job.
- Upstream license
-
Zero files copied. Four upstream skills were studied and none reused; two of the four ship no LICENSE at all, so the bundle carries a licence-compliance record instead of code. The v0.2.0 sketchy filter is adapted with attribution from cathrynlavery/diagram-design (MIT, commit da45d4a), with zero prose copied and the provenance grep run.